Quantcast
Channel: meter | Battery Guide
Viewing all 90 articles
Browse latest View live

A Digital temperature meter using an LM35 temperature sensor using PIC16F688

$
0
0

Introduction

A digital thermometer is a good choice of project for beginners who just stepped in to the world of microcontrollers because it provides an opportunity to learn using sensors to measure the real world signals that are analog in nature. This article describes a similar project based on a PIC16F688 microcontroller and an LM35 temperature sensor. LM35 is an analog sensor that converts the surrounding temperature to a proportional analog voltage. The output from the sensor is connected to one of the ADC channel inputs of the PIC16F688 microcontroller to derive the equivalent temperature value in digital format. The computed temperature is displayed in a 16×2 character LCD, in both °C and °F scales.

temperature sensor

Theory

The LM35 series of temperature sensors are produced by National Semiconductor Corporation and are rated to operate over a -55 °C to 150°C temperature range. These sensors do not require any external calibration and the  output voltage is proportional to the temperature. The scale factor for temperature to voltage conversion is 10 mV per °C. The LM35 series sensors come in different packages. The one I used is in a hermatic TO-46 transistor package where the metal case is connected to the negative pin (Gnd).

The measurement of negative temperatures (below 0°C) requires a negative voltage source. However, this project does not use any negative voltage source, and therefore will demonstrate the use of sensor for measuring temperatures above 0°C (up to 100°C).

The output voltage from the sensor is converted to a 10-bit digital number using the internal ADC of the PIC16F688. Since the voltage to be measured by the ADC ranges from 0 to 1.0V (that corresponds to maximum temperature range, 100 °C), the ADC requires a lower reference voltage (instead of the supply voltage Vdd = 5V) for A/D conversion in order to get better accuracy. The lower reference voltage can be provided using a Zener diode,  a resistor network, or sometime just simple diodes. You can derive an approximate 1.2V reference voltage by connecting two diodes and a resistor in series across the supply voltage, as shown below. As a demonstration, I am going to use this circuit in this project. I measured the output voltage across the two diodes as 1.196 V. The resistor R I used is of 3.6K, but you can use 1K too. The important thing is to measure the voltage across the two diodes as accurate as possible.

We need do some math for A/D conversion. Our Vref is 1.196 V, and the ADC is 10-bit. So, any input voltage from 0-1.196 will be mapped to a digital number between 0-1023. The resolution of ADC is 1.196/1024 = 0.001168 V/Count. Therefore, the digital output corresponding to any input voltage Vin = Vin/0.001168. Now, lets see how to get the temperature back from this whole process of converting sensor’s output to 10-bit digital number.

Assume, the surrounding temperature is 26.4 °C. The sensor output will be 264 mV (0.264 V). The output of ADC will be 0.264/0.001168 = 226. If we reverse this process, we have 226 from ADC and we can go back and find the temperature by using the sensor scale factor (10 mV/°C),

temperature = 226 * 0.001168 (V/Count) / 0.01 (V/°C) = 26.4 °C

If you want to avoid floating point math in your program, just use,

temperature = 226 * 1168  = 263968

While displaying this, you need to put a decimal at the fourth place from the left. So the calculated temperature is 26.3968°C, which is pretty close to the actual one. The difference is caused by quantization and rounding errors. In this project, we will display temperature accurate to one decimal place, i.e., we will divide the above number by 1000 to get 263. So the temperature will be displayed as 26.3 °C.

Once you have derived the temperature back in °C, you can convert it to °F using a simple equation,

temperature in °F = 9 x temperature in °C /5 + 32

In this case, the number you got for °C is scaled by 10 (263 for 26.3), you should use

temperature in °F = 9 x temperature in °C /5 + 320

Since, the number for °C may not be exactly divisible by 5 (such as 263 is not), you can further eliminate the floating point by scaling it one more time by 10. So the new equation will be,

temperature in °F = 9 x temperature in °C x 10 /5 + 3200

or, temperature in °F = 18 x temperature in °C  + 3200 = 18 x 263+3200 = 7934

79.34 °F is equivalent to 26.3 °C. In this project, it will be displayed as 79.3 °F.

Circuit Diagram

An external reference voltage to the internal ADC of PIC16F688 can be provided through RA1 I/O pin. The output from the LM35 sensor is read through RA2/AN2 ADC channel. The temperature is displayed on a 16×2 character LCD that is operating in the 4-bit mode. A 5K potentiometer is used to adjust the contrast level on the display. The detail circuit diagram is given below. Note that the PIC16F688 uses its internal clock at 4.0 MHz.


For more detail: A Digital temperature meter using an LM35 temperature sensor using PIC16F688

Current Project / Post can also be found using:

  • temperature sensor using pic micro with negative reading

The post A Digital temperature meter using an LM35 temperature sensor using PIC16F688 appeared first on PIC Microcontroller.


Wireless MultiMeter using PIC18F452 Microcontroller

$
0
0

This project comes as a KIT. It includes these components:

  • Low-cost DMM (digital multimeter) M830D
  • TX (transmitter) circuitand  wireless module TX-433. These are mounted within the DMM housing.
  • RX (receiving) circuitwith a  wireless module RX-433, LCD and piezo buzzer.

The general idea is to read all LCD data from a cheap DMM (directly from its main chip.) This data is sent and received by wireless modules, read by the RX circuit and then displayed again. Sounds pretty easy, not?

Wireless MultiMeter


Here are the technical specifications:

  • Low power operation (8-10 mA @9V) with PIC 18F452 (TX) and 18F2550 (RX) microcontrollers running at 4 MhZ.
  • Sampling rate: around 3 samples/sec.
  • Max. distance between the RX and TX circuits: 30m indoors and 100m outdoors.
  • Software is 100% upgradable with a simple bootloader.
  • Low power LED blinks when sending / receiving data.
  • TX circuit: PCB Dimensions: 30 x 31 mm or 1″18 x 1″22, weight: 8 grams.
  • RX circuit: LCD contrast adjustable by user.
  • RX circuit: PCB Dimensions: 40 x 41 mm or 1″57 x 1″61, weight: 10 grams.


  Hex files available. Last update: June 1, 2006.

RS232 interface: JP2 provides the interface to connect to your COM port and hyper terminal. Also used for bootloading (module software update.) Check under the download section below for the latest version. Bootloading of the HEX-file can be done with Tiny Bootloader.


RX circuit, LCD contrast Adjust: Connect pin 5, JP3 to +5V before powering up. Release when the desired the contrast is reached.


Downloads: right-click & save as

TX circuit HEX: 025tx_v10.hex for 18f452 – May 31, 2006.

 RX circuit HEX: 025rx_v009.hex for 18f2550 – June 1, 2006.

Both can be bootloaded with  Tiny PIC bootloader through the RS232 port (JP2)


 TX & RX circuit schematics, pcb layouts and CCS C Source Code: not released, but you can buy a license on our Products page.

For more detail: Wireless MultiMeter using PIC18F452 Microcontroller

Current Project / Post can also be found using:

  • wireless multimeter project
  • dmm using pic 18
  • dmm using pic design n code
  • dmm using pic18f4520 micro controller

The post Wireless MultiMeter using PIC18F452 Microcontroller appeared first on PIC Microcontroller.

Harmonic Distortion Meter using PIC18F2550

$
0
0

The 3rd harmonic distortion meter has been designed for measuring the quality of AC supply. The meter is built with a PIC18F2550 project board and the full wave rectifier front-end circuit. The AC power line, 220VAC is measured through the step down isolation transformer. The input signal to the 10-bit ADC is full wave rectified. The software performs DFT calculation finding the amplitude of the fundamental frequency and the 3rd harmonic. The distortion is computed by the ratio of the amplitude of the 3rd harmonic to the fundamental frequency. The meter has been tested with the square wave signal resulting 33% distortion. For low voltage AC utility, 220V, the reading showed approx. 3%. The meter can be applied for high voltage application with the appropriate signal conditioning.

Harmonic Distortion Meter

Introduction

Nowadays an increasing of the electronic devices having nonlinear characteristics are many used at home and office. Such devices mostly are computer based equipment with a low power factor switch mode power supply. The input circuit of the power supply uses a diode-capacitor at the front-end circuit. The current drawn is charging capacitor only near the peak voltage. Thus for a given feeder having finite impedance, there will be a lost from voltage dropped near the peak voltage resulting flattened top distortion of the AC voltage. To measure how high the distortion of AC voltage is, we may decompose it into the summation of sinusoid waves using DFT. The PIC harmonic distortion meter shows a method for finding the amplitude of the fundamental frequency and the 3rd harmonic. The reading shows percentage of the 3rd harmonic distortion.

Total Harmonic Distortion, THD

To measure the waveshape distortion, we use the quantity of the Total Harmonic Distortion, THD (equation 1). THD is the ratio of the power of harmonic components to the power of fundamental frequency. Our concern is the voltage distortion, we can just find the sum of the rms of the harmonic components, Vn and the rms of the fundamental frequency, V1.


For more detail: Harmonic Distortion Meter using PIC18F2550

The post Harmonic Distortion Meter using PIC18F2550 appeared first on PIC Microcontroller.

0-5V LCD volt meter using PIC16F877A

$
0
0

This PIC LCD volt meter project uses a PIC micro and an HD44870 LCD display. The analogue input is taken directly to the analogue input pin of the microcontroller without any other processing.

So the input range is from 0V to 5V – the maximum source impedance is 2k5 (for testing use a 1k pot). To improve the circuit add an opamp in front to present greater impedance to the circuit under test. The output impedance of the opamp will be low which is a requirement of the PIC analogue input.

Specification

 volt meter

Voltage range 0V – 5V
Input signal level TTL
Maximum input impedance 2k5

The LCD volt meter uses the microcontroller power supplies as reference voltages and so it is not likely to be very accurate (e.g. a 7805 5V regulator has an accuracy of 5%). You can make it more accurate by setting the scaling value in the software to match the power supply (measuring the supply using a voltmeter) (see Calibration later).

The most accurate way of all will be to use a voltage reference and feed this into RA3 as the positive reference value but this project simply provides a quick and easy way of measuring volts without circuit complexity.

The project mainly shows how to control and setup the software to read an analogue value from the first analogue port RA0.

Note when designing using the analogue inputs its a good idea to start from AN0 as there is only a limited set of ways that more analogue ports can be selected for use (see the chip data sheet – analogue inputs).

PIC lcd volt meter Hardware

You can use any PIC microcontroller that has an ADC and enough memory to hold the program.

The LED is pulsed after every ADC acquisition to indicate that the processor is alive – so you can tell if the software is active.

You can program the PIC in circuit through the ICSP connector.

For more detail: 0-5V LCD volt meter using PIC16F877A

Current Project / Post can also be found using:

  • data acquisition for voltmeter using pic

The post 0-5V LCD volt meter using PIC16F877A appeared first on PIC Microcontroller.

Server response time meter

$
0
0

The Meter

2014-12-01 21:12:00

Been awhile since I posted anything here, so I thought I’d use this post to give some more detail on a project I just completed. The whole idea was to create a giant meter to show website response time almost like a speedometer would. The result is something that’s both fun to watch and provides a meaningful ‘heartbeat’ of current status. After several revisions and different designs along the way, I ended up with what you see here.

Server response time meter

Construction & Design

The meter is carved using my CNC machine from 1/4″ bi-color HDPE (12 inches square). This is a great material to cut signs or other carvings with because anything carved out is the alternate material color, so there’s no painting/masking/re-painting needed. The needle is cut from 1/8″ orange acrylic which worked great for the speedometer theme. For mounting the micro servo, I designed a hole matching the shape of the outer plastic casing which the servo I chose had (see parts list for a link). I designed the whole thing using Inkscape and Easel, mainly because they are free and fairly easy to use. Check out my bill of materials if you are interested in using the same HDPE and acrylic.


For more detail: Server response time meter

The post Server response time meter appeared first on PIC Microcontroller.

USB 0-500MHz RF Power Meter with AD8307 using pic microcontoller

$
0
0
AD8307 USB 0-500MHz RF Power Meter Component List:

1x PIC18F2550 Programmed Microcontroller
1x AD8307 RF Power Meter IC
1x RF Power Meter Probe PCB
1x USB IO Board PCB
1x USB Type B Connector
1x 20MHz Crystal Resonator
1x 470K Resistor (yellow purple yellow gold)
2x 10K Resistor (brown black orange gold)
2x 100 Resistor (brown black brown gold)
1x 470nF Ceramic Capacitor
5x 100nF Ceramic Capacitor

  Technical Specifications:

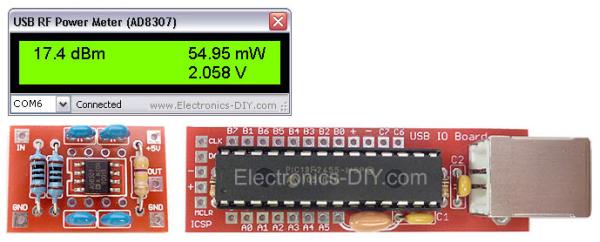
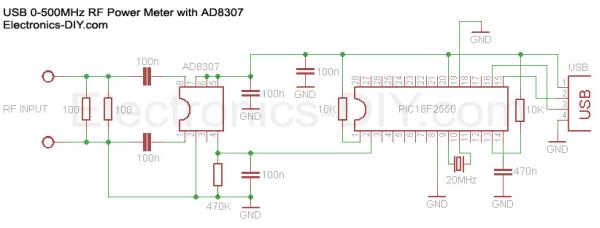
Measures transmitter RF Power from 1nW to 2W (50W with 40dB attenuator) / -66.6dBm to 33dBm
Auto-range RF Wattage Measurement: nW, uW, mW and W
Frequency Input: 0-500MHz
Self-powered by USB port
Can measure higher RF power with addition of simple 10-40dBm resistor attenuator

USB 0-500MHz RF Power Meter with AD8307AD8307 USB 0-500MHz RF Power Meter

Measurement of transmitter output RF power has never been easier and more precise. AD8307 USB 0-500MHz RF Power Meter allows to measure the power of transmitters from 1nW to 2W / 50W with 40dB attenuator. Output is displayed in dBm, Watts (nW, uW, mW and W range) as well as input voltage. USB RF Power Meter is based on popular AD8307 watt meter IC and PIC18F2550 microcontroller. Instead of using LCD display module the meter connects to a PC via USB port and displays measurements on a computer via USB RF Power Meter software. The software settings can be changed to use 10-50dBm attenuator and thus allowing to measure RF power higher than 2W.
AD8307 RF Power Meter Probe
AD8307 RF Power Meter Probe is used to measure the strength of RF power and may be mounted in a small metal enclosure. To measure output RF power of transmitter connect AD8307 probe input directly to the output of your transmitter (antenna output). AD8307 probe should be connected to USB IO Board by using three wire cable. The three wires provide power for the probe that is drawn from USB port through USB IO Board, ground wire and output that connects to PIC18F2550’s PIN2 (A0).
USB 0-500MHz RF Power Meter with AD8307USB IO Board

USB IO Board is used to sample voltage from AD8307 chip and pass the information in a digital format to a PC via USB port. The board consists of very few components; mainly PIC18F2550 microcontroller, standard USB Type B connector, breadboard compatibille PCB, 20MHz crystal resonator, two capacitors and two resistors.

Current Project / Post can also be found using:

  • Rf power meter pic

The post USB 0-500MHz RF Power Meter with AD8307 using pic microcontoller appeared first on PIC Microcontroller.

Trinket Powered Analog Meter Clock

$
0
0

Overview

Trinket lends itself very well to building clock projects, its small and easy to hide behind a larger display. And clocks don’t need a lot of logic, this example only has maybe 20 lines of code. Adding a digital display via I2C is possible using seven segment or character-based displays (with the library code posted for other projects).

This project interfaces Trinket to the the Adafruit DS1307 real-time clock (RTC) breakout board to form a clock. But in a twist, the display is done using two analog meters. One for hours, one for minutes.

The Trinket can output to a meter without digital to analog converters. Trinket has pulse width modulation (PWM) on three of its pins. The meter uses a moving coil inductance movement, acting to average the indication of current flowing through it. If you have narrow pulses, the average voltage it sees is lower, thus the current is lower for the fixed resistance attached to it. For wide pulses, the meter sees nearly the supply voltage and will stay around the full scale. This circuit varies the pulse width sent to the meters proportional to the hour of the day and the minutes after the hour.

For two meters, we will use two of the three PWM pins on Trinket (the third is also an I2C pin connected to the clock module).

There are several projects on the web using analog meters to tell time. The ease at which you can do this with Trinket allows you to build this type of clock quickly and compactly. You may focus on designing how to mount the meters in a creative way.

There are many ways to display the finished project. Rather than a cabinet or plexiglass display, I chose meters free-floating in a colorful box. I think it lends a modern look.

You can check Google Images for “Clock Analog Meter” for other mounting designs. Designing your own solution is the best part of such a project.
Trinket Powered Analog Meter Clock

Building the Circuit

Start by unpacking your Trinket. If you will use a breadboard or Perma-Proto board, you will want to solder on the header pins (provided). See Introducing Trinket on doing this and general information.

Unpack your DS1307 kit. This requires assembly also. Please follow the DS1307 Real Time Clock Breakout Board Kit tutorial on building your clock module.

Trinket can be powered from 3.7 to 16 volts via the BAT+ input and ground. This makes powering the clock very flexible. For this project, I chose the 5V Trinket as the DS1307 board has a 5 volt input which may be connected to the 5V output pin on Trinket. If you use another RTC module that works at 3.3 volts, the Trinket 3V may be used with appropriate changes to the meter calibration. I show powering via DC supply (wall wart). Battery use will vary depending on the batteries you choose. A 9 volt battery will not last very long and is not recommended.

For a 5 volt Trinket and 50 microamp meters, for full scale deflection we need a series resistor on each meter to keep the current less than or equal to the maximum current the meter can handle. Using Ohm’s law, R = V / I = 5 / .00005 = 100,000 ohms (100 K). You will need two of these resistors, preferably 5% or better tolerance. These are commonly available from electronics suppliers. If you want precision in calibrating the meter, you may want to substitute each resistor with a 100K potentiometer with a series resistor, perhaps 10 to 47 K. This allows for tuning the resistance. When I designed the project, the 100K resistors gave accurate enough time without needing potentiometers.

Do not directly connect the meter to a source of voltage as it will damage the meter. Use an appropriate series resistor in the circuit to limit the meter current.
Wiring is straightforward. All the pins are used except GPIO #3. I used this pin temporarily to connect to an FTDI Friend. On Trinket you can run a software serial library that transmits only. This was handy in debugging the circuit as it gives you console-like output using only one pin and ground.
The text will show the date and time along with two numbers which represent numbers from 0 to 255 for a pulse width corresponding to the time. Above, 255 shows this is noon, 13 minutes after the hour is 55/255 (not quite 1/4). If you are not getting this type of output on serial, check your connections and code.

Preparing to Code

 Using the Introducing Trinket tutorial, modify the Arduino IDE to work with Trinket by adding the hardware definition file, the avrdude.conf file, changing the ld.exe program from the 2008 dated version to the 2009 dated version, and install the driver for USBtinyISP appropriate to your operating system.
You must follow the instructions in the Introducing Trinket tutorial to set up your Arduino development environment properly, failure to do all the steps will not allow you to program a Trinket properly.

To prepare the Trinket for other programs, you will want to first load the Trinket Blink sketch into the Arduino software then load it onto the Trinket to verify everything works well. You must press the hardware reset button on the Trinket then quickly press upload in the Arduino software to upload a sketch. If you get an error, try the reset-upload process again. If you continually cannot load the blink sketch, check to make sure the Trinket is connected (without any wires connected to pins #3 and #4) and the Arduino IDE software has all the required changes.

Once the Blink sketch works, you should install the TinyRTClib and TinyWireM libraries. Installation of the libraries is as follows:

  1. Visit each of the code pages at Github.com: TinyRTClib and TinyWireM
  2. Select the “Download ZIP” button
  3. Uncompress each ZIP file after it’s finished downloading.
  4. The resulting folder should contain the code files and an “examples” sub-folder. Sometimes in Windows you’ll get an intermediate-level folder and need to move things around.
  5. Rename the TinyWireM library folder (containing the .cpp and .h files) to “TinyWireM”, and place it alongside your other Arduino libraries, typically in your (home folder)/Documents/Arduino/Libraries folder. Libraries should not be installed alongside the Arduino application itself.
  6. Do the same for the TinyRTClib library.
  7. Re-start the Arduino IDE if it’s currently running.

Here’s a tutorial that walks through the process of correctly installing Arduino libraries.

Now you are ready to copy the sketch on the next page for your clock.

Debugging Issues

For errors in the Arduino IDE software:

  • Ensure you have installed Trinket extensions, the USBtinyISP driver, and changed the ld.exe program as listed in the Introducing Trinket tutorial.
  • Ensure you have installed both the TinyWireM and TinyRTClib libraries..
  • Ensure you push the Trinket on board reset button before uploading your sketch, the red LED will blink when ready for upload, there is a 10 second window to do this.
  • If you place a large amount of code or other libraries in a sketch, it is very easy to exceed the available code space on the Trinket. If your program absolutely will not fit, consider switching to an Arduino Uno, Adafruit Boarduino, Pro Trinket, or Adafruit Flora with standard libraries.
  • If you get errors similar to the one below, you may have included decimal numbers and the floating point library was added by the Arduino IDE, exceeding the amount of program space available.

arduino-1.0.1/hardware/tools/avr/bin/../lib/gcc/avr/4.3.2/../../../../avr/lib/avr25/crttn85.o:(.init9+0x2):relocation truncated to fit: R_AVR_13_PCREL against symbol `exit’ defined in .fini9 section in /arduino-1.0.1/hardware/tools/avr/bin/../lib/gcc/avr/4.3.2/avr25\libgcc.a(_exit.o)

The code on the next page still leaves a good deal of space for additional functionality, especially once the serial code is no longer needed. If you declare large arrays, define large text strings, add decimal/floating point numbers, or other libraries, the space may fill up or overflow.

Code

 You will want to run the sketch twice, once to set the clock, another to have it operate. The code in setup() checking for rtc.isrunning() should be uncommented. This will set the clock to the time your code is compiled. You can then recomment out that code as the DS1307 will keep the time.

If you plan to have the code function differently than the sample or have problems you want to debug, having a serial monitor will help. I have tried the SendOnlySoftwareSerial library available in this arduino.cc post with good results. It adds about 1300 bytes of overhead so you will want to comment out the serial code in your sketch when you do not need it.

The post Trinket Powered Analog Meter Clock appeared first on PIC Microcontroller.

Bluetooth Wireless Voltage Meter using PIC12F683 microcontroller

$
0
0

Bluetooth Wireless Voltage Meter using Wiimote + Pic Chip + AutoIt

In this tutorial I’m going to be showing you how you can send voltage values to your pc using a Pic chip, Wiimote, and Autoit3 scripting language. The process works by wiring a pic chip to the button pads of a wiimote. Then using the pic chips Analog to Digital Converter, we obtain a 10bit binary value. We will then send that value to Autoit in the form of button presses using the wiimote as a data interface.  On the PC side we will use a library I wrote to receive the data from the wiimote. The library is basically just a port to Wiiuse by Michael Laforest set up in a way to make scripting with the wiimote very easy.

Analog to Digital Converter

Most pic chips are equiped with multiple Analog to Digital channels. This lets us monitor multiple voltages values if we want to. The total amount of channels sampled will depend on different factors like how many channels the chip has. Channels are sampled one at a time so the more voltages you monitor, the less samples per second you get.

How the Analog to Digital Converter works
The pic chip A/D Converter works by comparing the voltage you’re measuring to a known voltage. In our case the known voltage is the voltage supply 5v. The 10bit value measured is a ratio of the pic chips known voltage 10bit value. So for example a sample thats 10bit value is 387, the voltage value would be V = (5v/1024) * 387    which equals 1.89v

Step 1

Experience, Tools and Parts Needed

Experience:
• Basic understanding of electronics. (Ohms law for example..)
• How to use a bread board and voltage meter.
• How to solder.
• A little knowledge of pic chips will help, but is not really required since all the pic chip code for the examples is already written.

Tools:
• Voltmeter
• Triwing Screwdriver for wimote. ($2 on ebay)
• Soldering Iron, solder
• Breadboard and Jumper wires
• Pic Chip Programmer (Im using the “Enhanced PICKit 2”)
• PC with Bluetooth

Parts: ($20 + $1 + $1 + $5 + $7) = $34
Wiimote –  note that while generic wiimotes will work, a genuine wiimote has best compatibility.     (< $20)
• Transistors 2N3904 or any General Purpose NPN  Qt: 11  ($1)
Resistor values 470K (390K to 560K will work):  Qt: 11  ($1)
• Pic Chips (any of these will work since I have included multiple examples)
PIC12F683-I/P or PIC12F675-I/P – 2 examples    ($1.25)x2
PIC16F616-I/P  –  – 2 examples –    ($1.10)x2
– shipping for all 4 pic chips   ($7)
• 5v supply for the Pic Chip

Step 2

Software

Download and install the following software(click links to download)

AutoIt3

Scite4AutoIt3

HI-TECH C Compiler for PIC10/12/16 MCUs (Free Lite Version. Registration is required)
Wiimote ADC.zip (Note: The html link is just an easy way for me to share, update, and track downloads. Open the .html file and a download dialog will display.)

The Wiimote_ADC.zip contains the following:
WiimoteMT.au3 – Autoit Library used for communicating with the wiimote.
Wii Pair.exe –  used to pair the wiimote to your pc.
ScitePIC Startup.exe – A custom standalone Scite Editor that I set up just for working with the pic chips. It has options to compile and program the pic chip for you. I will get into how to use those options later.
• 6 AutoIt script examples along with the Pic chip code that goes with each example.
• 4 Pic chip Hi-Tech C example programs. (2 supporting 12F683 and 12F675, 2 supporting 16f616.

Step 3

Pairing the Wiimote

To pair the wiimote to your pc you have two choices. You can either do a temporary pair, or you can do a permanent authenticated pair. The difference between temporary and permanent pairing is that if you power off, or disconnect  the wiimote from your pc and the wiimote is not authenticated, the next time you want to connect you will have to do the pairing procedure again. If it is authenticated, your pc will remember the wiimote, and the wiimote will remember your pc. Needless to say i recommend doing a permanent pair.

Permanent Pair:
-Launch Wii Pair.exe (located in Wiimote_ADC.zip)
-Press the sync button on the wiimote located under the battery cover. The leds on wiimote will begin flashing.
-Press Easy Pair button.
– When the wiimote has been successfully paired you will see the address of your wiimote in the list and Connected, Remembered and Authenticated will all say true. Once it has verified that the wiimote is authenticated it will launch a wiimote example.
NOTE: IF at any time during the pairing process the wiimotes leds stop flashing, PRESS THE SYNC BUTTON AGAIN.

Temporary Pair:
-Go into your bluetooth panel and select “add a new device”. Press the sync button. When it asks you about the pairing code, select the option to pair without using a code.

For more detail: Bluetooth Wireless Voltage Meter using PIC12F683 microcontroller

Current Project / Post can also be found using:

  • hitech c bluetooth
  • voltage monitoring using bluetooth

The post Bluetooth Wireless Voltage Meter using PIC12F683 microcontroller appeared first on PIC Microcontroller.


A simple 50 MHz diy microwattmeter using PIC16C84

$
0
0

Summary.

A design for a simple microwattmeter. Input range -75 dBm to + 5 dBm. Frequency range 2 to 50 MHz. Level resolution is 0.1 dBm, frequency resolution is 10 kHz. Log-output about 0.5 – 3.5 Volt. Output for external counter. The meter uses a AD606 as log-converter, a MAX186 as ADC, a PIC16C84 as controller and a HD44780 type LCD. The PIC measures frequency and level of the input signal and calculates level in dBm using frequency-dependant factors. Details of the design are provided as well as a listing of the PIC assembler program.

micro watt meter

In January 1997 I saw the datasheet of the Analog Devices AD606, a chip that will convert a -75 dBm to +5 dBm RF input level to a corresponding DC output between 0.5 and 3.5 Volts. The chip will work up to 50 MHz. It also has a limiter output for frequency measurement purposes. I tried the AD606 using a basic application circuit as recommended in the datasheet.

At the same time I saw designs appearing which used a Microchip PIC16C84 microcontroller. It seemed that this chip was well suited to the needs of the hobbiest: simple architecture, cheap, 1024 words of eeprom program memory and easy to program and reprogram using a programmer you can build yourself.

First, I subscribed to the PICLIST This list proved to be an invaluable tool to quickly learn about most aspects of PIC microcontrollers. I first built the programmer, using the design of David Tait . David has a schematic and software for a low-cost programmer to connect to a PC parallel port. I then used his example of a first circuit to build, a simple LED-flasher.

Next, I acquired some used LCD character displays using a Hitachi HD44780 controller. How to use these things ? Again, David Tait had a simple C program to test LCD displays connected to a PC parallel port. I also read the excellent LCD overview by by Peer Ouwehand .

I then downloaded the necessary assembler (MPASM) from Microchip and used Peer’s examples to test a PIC16C84 and a display. This worked well so I began thinking of constructing a serious application: a PIC controlled microwattmeter. This instrument would use the AD606, and the PIC would control an ADC to measure the AD606 output voltage and also count the AD606 limiter pulses to give an indication of the signal frequency.

First I concentrated on measuring frequency. Numerous examples to do this with a PIC are available, I used an example provided by Simone Benvenuti and Andrea Geniola , I don’t remember from which site I picked up the example. In this design frequency is measured by counting pulses on RA4 during one millisecond.

counter micro watt meter

This time is determined by a delay loop. The counter is activated during this time by three-stating another pin (in this example RB0) connected to the counter pin. The counter is stopped by pulling this pin low. The measured frequency thus has a resolution of 1 kHz.


For more detail: A simple 50 MHz microwattmeter using PIC16C84

The post A simple 50 MHz diy microwattmeter using PIC16C84 appeared first on PIC Microcontroller.

PIC Harmonic Distortion Meter

$
0
0

The 3rd harmonic distortion meter has been designed for measuring the quality of AC supply. The meter is built with a PIC18F2550 project board and the full wave rectifier front-end circuit. The AC power line, 220VAC is measured through the step down isolation transformer. The input signal to the 10-bit ADC is full wave rectified. The software performs DFT calculation finding the amplitude of the fundamental frequency and the 3rd harmonic. The distortion is computed by the ratio of the amplitude of the 3rd harmonic to the fundamental frequency. The meter has been tested with the square wave signal resulting 33% distortion. For low voltage AC utility, 220V, the reading showed approx. 3%. The meter can be applied for high voltage application with the appropriate signal conditioning.

PIC Harmonic Distortion Meter Introduction

Nowadays an increasing of the electronic devices having nonlinear characteristics are many used at home and office. Such devices mostly are computer based equipment with a low power factor switch mode power supply. The input circuit of the power supply uses a diode-capacitor at the front-end circuit. The current drawn is charging capacitor only near the peak voltage. Thus for a given feeder having finite impedance, there will be a lost from voltage dropped near the peak voltage resulting flattened top distortion of the AC voltage. To measure how high the distortion of AC voltage is, we may decompose it into the summation of sinusoid waves using DFT. The PIC harmonic distortion meter shows a method for finding the amplitude of the fundamental frequency and the 3rd harmonic. The reading shows percentage of the 3rd harmonic distortion.

To measure the waveshape distortion, we use the quantity of the Total Harmonic Distortion, THD (equation 1). THD is the ratio of the power of harmonic components to the power of fundamental frequency. Our concern is the voltage distortion, we can just find the sum of the rms of the harmonic components, Vn and the rms of the fundamental frequency, V1.

PIC Harmonic Distortion Meter Most of the harmonic problem is caused by the 3rd component. Since the 3rd harmonic is the 2nd highest energy from the fundamental component. So we interest to find only the 3rd harmonic distortion using equation 2.

We may decompose the periodic waveform, f(t) into the summation of a number of sinusoids waveform easily using the Discrete Fourier Transform (equation 3). A0 is the amplitude of DC components. For AC voltage waveform, A0 is zero.

For more detail: PIC Harmonic Distortion Meter 

The post PIC Harmonic Distortion Meter appeared first on PIC Microcontroller.

PIC 16f877 microcontroller based RPM Meter

$
0
0
Summary: The speed of the motor is measured in Rotations per Minutes,RPM.The RPM Meter is to read the running speed of Motor like DC MOTOR. Here the speed of the DC Motor is sensed with the help of a speed sensor and it is signal conditioned to have pulses which given as Timer1 clock input of PIC Microcontroller, configured to accept external clock input.The count value in Timer1 for one second represents speed in seconds which can be converted into RPM by multiplying the count by 60.The Display of the speed will be on Lyquid Crystal Display LCD .

AIM :

To develop a RPM meter using microcontroller & to display the speed on LCD Display PIC Microcontroller 16F877.
PIC 16f877 microcontroller based RPM Meter

INTERFACING:

  1. Pulses from speed sensor connected to TMR1 clock input-RC2
  2. Run/Hold push button switch connected to –RC4
LCD Display –
  • Data lines connected to Port C – RC0: RC7
  • Control lines connected to Port D – RD0: RD2
  • Timer0 used for generating time slice of 1/16 sec in interrupt driven mode
NOTE: DC motor, DC motor driver circuit, speed sensor, signal-condition circuit to be Provided.
DESCRIPTION:
Pulses from the speed sensor, after signal conditioning, is connected to Timer 1 input.
RPM meter works in two modes viz RUN & HOLD. The mode toggles for every push of the mode selection push of the mode selection push button switch:
HOLD Mode: Previous value of the speed is displayed
RUN Mode: Speed is measured for every second
  • By default meter will be in HOLD mode with display ‘00’.
  • Mode of operation and the speed are displayed on LCD
Figure4: Functional Flow Chart for RPM Meter
LIST P=16F877
#INCLUDE”P16F877.INC”
CBLOCK 20H
HEX1
HEX2
DEC1
DEC2
DEC3
DEC4
DEC5
DD1
DD2
DV1
DV2
Q2
Q1
TEMP
DISNO
DLOC1
DLOC2
ENDC
ORG 00H
GOTO MAIN
PIC 16f877 microcontroller based RPM Meter SchematicMAIN CLRF CCP1CON ; CCP Module is off
CLRF TMR1H ; Clear Timer1 High byte
CLRF TMR1L ; Clear Timer1 Low byte
CLRF CCPR1L
CLRF CCPR1H
CLRF INTCON ; Disable interrupts and clear T0IF
BSF STATUS, RP0 ; Bank1
BSF TRISC, 2 ; Make CCP pin input
CLRF TRISD
CLRF TRISE
CLRF PIE1 ; Disable peripheral interrupts
BCF STATUS, RP0; Bank0
CLRF PIR1 ; Clear peripheral interrupts Flags
MOVLW 07 ; Capture mode, every 4th rising edge
MOVWF CCP1CON
BSF STATUS, RP0
BSF PIE1, CCP1IE
BCF STATUS, RP0
MOVLW 21H
MOVWF T1CON ; Timer1 starts to increment 1:8 PRESCALAR MODE
; The CCP1 interrupt is disabled,
; do polling on the CCP Interrupt flag bit
Capture_Event
BCF T1CON, TMR1ON; off the timer after capturing the 4th pulse
BANKSEL TRISA
CLRF TRISC
BANKSEL PORTA
BCF PIR1, CCP1IF ; This need to be done before next compare
MOVF CCPR1L, 0
MOVWF HEX1
MOVF CCPR1H, 0
MOVWF HEX2
BCF STATUS, C ; for performing right shift
RRF HEX2 ; dividing the period by 2 i,e right shift
RRF HEX1;
CALL DIVIDE ; converting the period into frequency i,e RPS=Fclk / (capture period)


For more detail: PIC 16f877 microcontroller based RPM Meter

The post PIC 16f877 microcontroller based RPM Meter appeared first on PIC Microcontroller.

Weather meter using PIC 16F877 Microcontroller

$
0
0

Weather monitoring systems are available in plenty and these are pretty handy gadgets we use in our daily life for weather forecasting and other purposes. But these kinda gadgets might be expensive and may not be available for customization to our specified purpose. To overcome these advantages you can build this customized weather meter using PIC microcontroller which won’t cost much like those gadgets.

The system is built around PIC microcontroller where three parameters are measured in this system. Humidity,Temperature and ,Light intensity are the parameters this system takes as input to understand the weather condition. Then these parameters are displayed in the LCD screen for the user.

Weather meter using PIC 16F877 MicrocontrollerLM35 was used as a temperature sensor which is capable of sensing temperature ranging from -55 C to 150 C. The output voltage will be proportional to the temperature hence there is no need of trimmers. The output voltage of this sensor varies by 10mv per degree change in temperature.

Bought this Humidity sensor from a local store. The obtained output voltage is scaled to percentage and the reading in means of percentage is displayed in the LCD.

Simple LDR is used to measure the light intensity of the environment. Here LDR was used along with a resistor to form a voltage divider and the output is obtained from that divider. This output is also scaled to percentage and displayed in the LCD for the user.

Weather meter using PIC 16F877 Microcontroller Schematic

ALGORITHM:

  1. Initialize the LCD display.
  2. Display “H” , “L” and “T” which represents the parameters Humidity, Light intensity and Temperature.
  3. Define various weather conditions such as Sunny, rainy ,etc  for the expected sensor readings.
  4. Initialize the ADC Channels for the respective sensors.
  5. Read the sensor output one by one.
  6. Make appropriate conversion of the ADC value.
  7. Display the sensor values in the LCD display for the user.


For more detail: Weather meter using PIC 16F877 Microcontroller

Current Project / Post can also be found using:

  • pic16f84a thermostat using temperature sensor pdf
  • sms base whether forcasting using pic18f ic
  • temparetor mesure by pic

The post Weather meter using PIC 16F877 Microcontroller appeared first on PIC Microcontroller.

Tampered Energy Meter Monitoring Conveyed to Control Room by GSM with User Programmable Number Features

$
0
0

The main concept of this project is to reduce the power theft by using an integrated energy meter such that whenever an energy meter is tampered, it sends an alert message to the concerned authorities through the GSM modem for indicating power theft.

Tampered Energy Meter Monitoring Conveyed to Control Room by GSM with User Programmable Number Features Day by day  increase in the usage of electricity is leading to several attempts of tempering the energy meter by the masses. The routine way of identification of tempered meters by the electricity department wherein – the department sends employees to check out this issue – is  quite an expensive and time-consuming job. With this proposed system, it is possible to detect the meter tampering.

The proposed system uses a microcontroller of the 8051 family and a rectified power supply. In this system, the GSM modem interfaced to the microcontroller through a level shifter and a serial cable. A16*2 LCD display is connected to the microcontroller for displaying the information.

The energy meter is integrated in such a way that anybody  opens the cover of the meter; an IR sensing arrangement sends commands to the microcontroller. Then the microcontroller gives the command to the GSM modem to send an SMS to the selected mobile number stored in the microcontroller by the program. This information also gets displayed on the LCD.

Tampered Energy Meter Monitoring Conveyed to Control Room by GSM with User Programmable Number Features SchematicThis project in future can be implemented by an added feature of disconnecting the supply to the load by electricity department through an SMS in case of any tampering attempt of the energy meter.


For more detail: Tampered Energy Meter Monitoring Conveyed to Control Room by GSM with User Programmable Number Features 

The post Tampered Energy Meter Monitoring Conveyed to Control Room by GSM with User Programmable Number Features appeared first on PIC Microcontroller.

Voltage, Temperature & Frequency Meter With PIC Micro controller

$
0
0

Features…

  • Voltage, Temperature and Frequency can switching to each others using push buttons.
  • Voltage Meter can measure DC voltage between 0v to 50v.
  • Frequency Meter can measure frequency up to 65KHz.
  • Temperature Meter can use between 00C to 1500C.
  • Every functions can paused using push button.

Voltage, Temperature & Frequency Meter With PIC Micro controller

Instructions…

Voltage meter – 

Volt meter can measure dc voltages up to 50v. 5V is the maximum voltage can handle PIC microcontroller, as it is voltage divider (10K,1.1K) use for convert 50V to 5V . 5v zener diode use for safety of PIC microcontroller analog input pin.

Temperature meter – 

Temperature meter can use between 00C to 1500C. But LM35 sensor can use between -550C to 1500C. Sensor’s resistant is changing opposite to temperature, as it is maximum temperature gives maximum voltage output(5v)  and minimum temperature gives minimum voltage output(0v).  

Frequency meter – 

Theoretically, frequency meter can use up to 65KHz, that is because this circuit made by using Timer 1(16bit) of PIC microcontroller.

Voltage, Temperature & Frequency Meter With PIC Micro controller schematicTimer 0 can only measure up to 256Hz, that is because timer 0 is 8 bit timer. Transistor part is use for safety of microcontroller from amplitude of wave signal. This circuit can apply 12v amplitude or more changing transistor base resistor value(4.7K). I tested it, using 12v amplitude square wave signal

Troubleshooting…

If you have problem about accuracy of voltmeter, temperature meter and frequency meter, you can change values (*1,*2,*3)


For more detail: Voltage, Temperature & Frequency Meter With PIC Micro controller

Current Project / Post can also be found using:

  • temperature measurement project
  • pic based voltage frequency temperatire measurement
  • tempareture measurement using microcontrolar mini project
  • temperature display device in pic microcontroller

The post Voltage, Temperature & Frequency Meter With PIC Micro controller appeared first on PIC Microcontroller.

30 volts Panel Volt Meter Using PIC MCU

$
0
0

This is a simple application of internal 10-bit ADC(analog to digital  converter) of PIC16F676 microcontroller.you can use this  circuit  to measure  up to 30 v dc. the possible  applications are on bench top power supply or as a panel meter in various system.

Circuit description 
            MICROCHIP’S PIC16F676 is the heart and brain of this circuit .the internal adc of the mcu with a resistor network voltage  divider is used to measure the input voltage . then 3 digest of comm anode 7 segment display is used to display final converted voltage. as you can see in the schematic the displays are multiplexed with each other . means we switch on one display and put the corresponding digit on this while other two displays are off this cycle go for each of the display. 30 volts Panel Volt Meter Using PIC MCU
you can find more about driving multiplexed 7 segment led display from a pic mcu in application note from microchip AN557 Four Channel Digital Voltmeter with Display and Keyboard
in my circuit the refresh rate is about 50hz.

as you can seen in the schematic the 47k resistor and 10 k trim pot is connected ias a voltage divider configuration  .we all know very well that by default pic micro controller ADC reference voltage is set to vcc(+5v in this case) . so what we have to do is make such voltage divider that can divide out maximum range 30 volts to 5 volts . so we need is Vin/6 ==> 30/6 =5v   voltage divider . and to keep as less as possible attenuation on the under test voltage we have to keep the voltage divider resistor value in few thousand ohms because it takes very little current from the target but as much to drive adc of pic.

calculation   
10bit adc resolution we get 1023 maximum count
with 5 v reference  we get  5/1023 = 0.0048878 V/Count
means if the adc count is 188 then input voltage is 188 * 0.0048878 == 0.918 volts
but now with the voltage divider  the maximum  voltage  is 30v so the calculations
will be  30/1023= 0.02932 volts/count
if now we get 188 then 188*0.02932==5.5 Volts
you can also increase  or decrease  the range by changing resistor network and the calculations a little bit.
the capacitor 0.1uf makes the adc input a bit stable because 10bit adc is really sensitive .30 volts Panel Volt Meter Using PIC MCU schematic
the 5.1v zener will provide over votage protection to the internal adc because it wont allow voltage more than 5.1v.
Accuracy and calibration 
overall  accuracy of this circuit is great but it totally depends on the values of 47K resistor and 10k trim pot . as fine as you can go by adjustment of the trim pot your accuracy goes fine.
calibration of this circuit is done by adjustment of the 10k trimpot around value of 7.5k or so .
all you have to do is take any standard power like 5v or 12v and apply that to the input of the resistor network and adjust the trimpot until you get correct value on the display

The post 30 volts Panel Volt Meter Using PIC MCU appeared first on PIC Microcontroller.


Capacitance Meter

$
0
0

Capacitors are vital components in electronics, but sometimes they are broken, or the value printed on the cap has become unreadable. Because my multi-meter does not have a capacitance measurement, I decided to make one!The principle of measuring capacitance is quite simple. The voltage of a capacitor charging through a resistor increases with time T. The time it takes to reach a certain voltage, is related to the values of the resistor and capacitor. In this project, we’ll use a 555 timer circuit as a monostable multivibrator. If that sounds like some dark magic to you, don’t worry, it’s quite straightforward. I’ll refer to the the Wikipedia page for the details, as we’ll focus on the things we really need: the schematic and formula. The time in which the capacitor C charges through the resistor R is given by: T = ln(3) x R x C = 1.1 RC. If we know the value of the resistor and the time, we can calculate the capacitance: C = T /

Capacitance MeterNow we need a device for measuring the time, and that is where the Arduino comes in. The time is defined by the state of the output pin of the 555 timer (pin 3). It will be HIGH when the capacitor is charging, and LOW when it’s not. This means the output generates a pulse with length T.
The Arduino will be connected to pin 3 and will be detecting the rising and falling edge (transition form 5V to 0V and vice-versa). By using the function micros(),


For more detail:

Capacitance Meter

The post Capacitance Meter appeared first on PIC Microcontroller.

Server response time meter

$
0
0

The Meter

2014-12-01 21:12:00

Been awhile since I posted anything here, so I thought I’d use this post to give some more detail on a project I just completed. The whole idea was to create a giant meter to show website response time almost like a speedometer would. The result is something that’s both fun to watch and provides a meaningful ‘heartbeat’ of current status. After several revisions and different designs along the way, I ended up with what you see here.

Server response time meter

Construction & Design

The meter is carved using my CNC machine from 1/4″ bi-color HDPE (12 inches square). This is a great material to cut signs or other carvings with because anything carved out is the alternate material color, so there’s no painting/masking/re-painting needed. The needle is cut from 1/8″ orange acrylic which worked great for the speedometer theme. For mounting the micro servo, I designed a hole matching the shape of the outer plastic casing which the servo I chose had (see parts list for a link). I designed the whole thing using Inkscape and Easel, mainly because they are free and fairly easy to use. Check out my bill of materials if you are interested in using the same HDPE and acrylic.


For more detail: Server response time meter

The post Server response time meter appeared first on PIC Microcontroller.

How to Create a Beer Bottle LED VU Meter

$
0
0

Create your own Beer Bottle LED Volume Unit Meter!

This instructable will show you how to create a LED beer bottle VU Meter. A volume unit meter is a device that is used to display a relative volume of audio signals. Basically, sound gets converted into electricity, then amplified and run into a dedicated IC (Integrated Circuit). The IC then determines the level of sound and outputs it accordingly onto its outputs. This particular VU Meter uses a LM3915 Dot/Bar Display Driver to determine the sound level. This circuit is more flexible than a regular VU Meter though, due to the fact that I incorporated a microcontroller into the project. This makes it a little more complex, but also way more flexible.

The main reason that I built this project is because I have always been fascinated with LEDs. There is just so many cool projects that a person can make with them. Also, a couple years ago I made a Chevrolet logo VU Meter which didn’t use a microcontroller. Although it was really cool, there wasn’t a lot that I could do with it once it was made. I had the options of bar mode or dot mode and that was it. With the help of a microcontroller, you can design a project so that you are able to turn on any individual LED or groups of LEDs at any of the 10 different sound levels. That makes things a little more challenging, but also more interesting.

By following each and every step, you will be able to complete your own beer bottle LED VU Meter just like this one. Or if you are feeling really ambitious, create your own customized LED VU Meter and just use this instructable as a guideline.How to Create a Beer Bottle LED VU Meter

Step 1: Skills Required

This isn’t a very difficult project to complete, however it does take quite a bit of time (especially if you make the PCB yourself). There are more than 330 drill holes in the PCB, 78 LEDs that have to be soldered into place and 224 SMD connections. Therefore you should possess the following skills:

– Basic knowledge of electronics
– Basic knowledge of boolean logic and digital circuits
– Know how to solder (This includes SMD parts)
– Know how to create a PCB
– Know how to program a PIC18F4550 microcontroller

Optional:
– Know how to use a multimeter (This is used if you run into errors)
– Know how to program in C
– Know how to use the MPLAB IDE and the C18 compiler

With enough time and patience, anyone can complete this project. If you are looking at this project right now and thinking that it may be too difficult for you, take baby steps and start building the smaller circuits inside of the main circuit and get accustomed to them. For example, play around with the PIC18F4550 and get to know how it works. Then play around with the LM3915 so you know how to operate it, etc. The schematic may seem intimidating, but its really not. Like most electronic circuits, it is comprised of a bunch of smaller electronic circuits all linked together.

Step 2: Tools Required

Here is a list of tools and supplies that were used to build this project:

– Solder
– Soldering Iron
– Flux Pen
– Multimeter
– Drill/Rotary Tool (If making a PCB)
– Needle Nose Pliers
– Side Cutters
– Scalpel/Utility Knife (Used for PCB touch-ups)
– PIC Programmer (I used a MPLAB ICD2 Clone)
– Anti-Static Tweezers for small SMD components
– Perfboard/Breadboard or Materials required to make a PCB
– Toothbrush and Rubbing Alcohol to clean the flux off the PCB

All of the tools are pretty basic and should be found on most electronic hobbyists workbenches.

Step 3: Components Required

Here is a list of the following electronic components required:

34x – 5mm Green LEDs
28x – 5mm Blue LEDs
16x – 3mm Yellow LEDs

2x – 1N4148 Fast Switching Diodes
1x – 1N4007 Rectifier Diode

1x – PIC18F4550 TQFP PIC Microcontroller
4x – 74HC595 SOIC 8-Bit Shift Registers
1x – LM3915N (DIP) Dot/Bar Display Driver
1x – LM7805 TO-220 +5V Regulator
2x – IRL510 TO-220 Logic Level MOSFETs
2x – MMBT2222A SOT23 Transistors

2x – 27pf 0805 Capacitors
1x – 0.1μF Ceramic Disc Capacitor
1x – 1μF Electrolytic Capacitor
1x – 4.7μF Electrolytic Capacitor
2x – 22μF Electrolytic Capacitors
1x – 47μF Electrolytic Capacitor
1x – 220μF Electrolytic Capacitor

36x – 100Ω 0805 SMD Resistors
8x – 10kΩ 0805 SMD Resistors
3x – 50Ω 0805 SMD Resistors
1x – 10kΩ SIL9 Resistor Network
1x – 10kΩ Trim Potentiometer
1x – 390Ω Through-Hole 1/4W Resistor
1x – 2.7kΩ 0805 SMD Resistor
1x – 2.2kΩ 0805 SMD Resistor
1x – 1kΩ 0805 SMD Resistor
1x – 4.7kΩ 0805 SMD Resistor

1x – RJ-11 6p6pc ICSP Connector
1x – 2-Pin 0.1″ Molex Connector
1x – 2-Pin 0.1″ Molex Header
1x – Electret Condenser Mic
1x – SMD Momentary Tactile Switch
1x – SPST Rocker Switch
1x – 2-Position DIP Switch
1x – 20MHz Through-Hole Crystal
1x – TO-220 Heat Sink

All these components I had already had on hand, but I would estimate the cost of this project to be around $40. I have shown a couple of the components used in this project in the photo.

Step 4: Schematic/PCB/Software/Data Calculator

Before we go on to how it works, I have posted the downloadable zip file below which includes:

– Circuit Schematic
– PCB Top and Bottom Layers (PDF and PNG)
– PCB Top Silkscreen (PDF and PNG)
– VU Meter Data Calculator Program
– PIC18F4550 Firmware

I thought I’d post this right away in the instructable so you have it as we go through the steps, rather than get it at the last step when we’re finished.

Step 5: How It Works

I will try to explain how it works in the next couple of paragraphs, however if you are still unclear as to how it works after reading them, check out the photos (they look really unprofessional, but they might help you understand the concept better). Just take your time and if you have any questions feel free to ask.

The first stage of the circuit is an electret mic pre-amplifer. An electret mic is great for applications like this because it is small and versatile, but it has a drawback. When it picks up sound it only puts a small signal, much too small for the LM3915 to even notice it. Therefore we have to amplify the signal of the electret microphone. The two MMBT2222A transistors are the heart of the amplifier and bring the signal of the electret mic up to a large enough value for the LM3915 to work with. Now the sound that goes into the mic gets converted into AC electricity.  In order for the LM3915 to be able to work with the amplified input signal, we need to convert the AC signal to a DC signal. This is taken care of by the 1N4148 diodes. Once the signal is converted to DC, it is fed into the signal line of the LM3915.

The second stage of the circuit is the LM3915 itself. We don’t need to actually know how the LM3915 works, we just have to know how to use it. If your curious, on page 7 of the LM3915 datasheet it shows a simplistic version of the internal wiring diagram. So, we now have a valid signal going into the IC, but how does the MCU (Microcontroller Unit) know what sound level the LM3915 is at? Well if you look at the schematic you’ll notice that each of the LM3915s outputs (LED1 – LED10) are fed into an input on the PIC18F4550. Each output is also tied high by a 10k resistor (I used a resistor network) because the LM3915s outputs are an open collector type. Meaning, the LM3915 can force its outputs into a low state (0v) but it cannot force them into a high state (+v). So when an output is not being forced low, the resistor is keeping it held high. If all of the outputs are in a high state, the LM3915 isn’t detecting any sound. If any or all of the outputs are low, the PIC18F4550 can then interpret the intensity level of the sound.

The third stage of the circuit is the PIC18F4550. The LM3915 may be the heart of the circuit, but the microcontroller is definitely the brains. This stage reads the outputs of the LM3915 and turns on the LEDs according to the sound level. The nice thing about using a microcontroller is that we can turn on any of the inside LEDs (the 28 blue LEDs inside the “bottle”) that we want. Therefore, there is an endless amount of animations that we can create and display (ok, maybe not endless…). I have also added an element to this circuit so that we can control the 16 3mm yellow LEDs which form the lemon at the top of the bottle and we can control the 34 5mm Green LEDs which form the bottle.

The fourth stage of the circuit is the 4x 74HC595’s. Once the MCU has read the sound level, it will then figure out which LEDs it wants to turn on and which LEDs it wants to turn off (this is stored in 4 bytes of data), then it will serially transmit the 4 bytes of data (one byte to each 74HC595) and latch it. Once the 74HC595’s have been latched, the individual LEDs will either turn on or off.

Step 6: Power Supply

The power supply is the most important part of any electronic device. It doesn’t matter how great the device is, having an unreliable power supply can ruin all of that. And having no power supply at all…well that just speaks for itself. In order for us to determine the requirements for a power supply we need to perform a few calculations.

In the schematic you will notice that there are 8 rows of 4x Green LEDs in series and 1 row with only two green LEDs in series, 3 rows of 5x Yellow LEDs in series and 1 row with only one yellow LED and 28x individually controlled Blue LEDs.

LED Voltage Drops:
Blue LED = ~3.3v
Green LED = ~2.2v
Yellow LED = ~1.9v

LED Current Calculations
Blue LED = (5.0v – 3.3v) / 100Ω
= 17mA per Blue LED

Green LED = (10.0v – (4 LEDs * 2.2v/LED)) / 100Ω
= 12mA per Green LED row

Yellow LED = (10.0v – (5 LEDs * 1.9v/LED)) / 50Ω
= 10mA per Yellow LED row

Max LED Current = (9 Green LED rows * 12mA/row) + (4 Yellow LED rows * 10mA/row) + (28 Blue LEDs * 17mA/LED)
= 624mA

74HC595 Current
I595 = Max 74HC595 Current Draw From All 4x 74HC595’s

ICC (Io @ 0mA) = 80uA per 74HC595

I595 = 80uA * 4 74HC595’s
= 320uA

Max PIC18F4550 Current @ 48MHz
IMCU = Max PIC18F4550 Current

IMCU = 50mA

Max LM3915 Current @ 20v (All outputs off)
ILM3915 = Max LM3915 Current

ILM3915 = 9.2mA (There was only ratings for 5v and 20v, so I chose 20v to be safe even though were running at 10v)

The last 3 values are found in each devices datasheets. I left out a few calculations where there is still current draw in the circuit just for the sake of simplicity (We got the main sources of current draw, the other few are next to negligible). We’ll make sure that we use a power supply that can supply more than the bare minimum that we need. So an approximate value of our current draw is:

Current Drawn From +10v Power Supply
Isupply = Total Current Drawn From +10v Power Supply

Isupply = 624mA + 320uA + 50mA + 9.2mA
= ~683.5mA

Checking my VU Meter when it is running at its max power consumption (All LEDs on) it draws 660mA. The reason it is lower than what we calculated is because we used the maximum current values in our calculations and not the typical current values (all those values are located in the datasheets). So at the very least, we’d want a +10v power supply that can supply 700mA. If you wanted to be safer (as I do), we’d use a +10v power supply that can handle 1.0A of current draw. The one I am currently using can actually handle up to 2.0A, which is way more than we need.

I run this VU Meter at  +10v, but it is capable of running reliably from +9v to +18v. Keep in mind that you will want to change the green and yellow LED resistor values if you use a higher voltage or you may put too much current through them and burn them out. Also, if you put a higher voltage through it you will need to use a heatsink that can dissipate the extra heat produced by the LM7805.

Step 7: Wasted Power and Heat Dissipation

Now we need to calculate the current that is drawn from the LM7805 +5v regulator so that we can calculate the power that it wastes. If you look at the schematic you’ll see that the green and yellow LEDs run right off of the +10v supply. The only components that use power from the +5v regulator are the 74HC595’s, the PIC18F4550 and the 28 Blue LEDs. So we can calculate Ireg by adding up the current draw of those components.

Ireg = Total Current Drawn From +5v Voltage Regulator
Iblue_total = Total Current Drawn From The +5v Regulator With All Blue LEDs On

Iblue_total = 28 Blue LEDs * 17mA per LED
= 476mA

Ireg = IMCU + I595 + Iblue_total
= 50mA + 320uA + 476mA
= 526.3mA

Now, because we are using a linear voltage regulator to step our voltage down from +10v to +5v for the PIC18F4550 and the 74HC595’s, we are going to have some wasted power. The larger the current draw through the linear regulator, the more power that will be wasted in the regulator. Here we will do some calculations and find the wasted power in the voltage regulator:

Vin = +10v
Vreg = +5v
Ireg = 526.3mA

Pwasted = (Vin – Vreg) * Ireg
= (+10v – +5v) * 526.3mA
= 2.63W

The power that is wasted by the LM7805 is 2.63W. Now you may be saying “Big deal, we’re not running it on a battery so we can afford to waste that power.” The only problem is that when a linear voltage regulator wastes power it turns that wasted power into heat. This is bad news for the LM7805, therefore we need to attach a heatsink to it to help it dissipate the heat that it generates. If I would have had a switching +5v regulator on hand I would have used it instead of the LM7805, simply because switching regulators are more efficient than linear regulators, which means less heat.

Step 8: LED Connections

This step builds off of Step 4: How It Works, so make sure that you understand step 4 quite thoroughly before you continue on to this step. In this step we will have a look at the PCB board and see where all of the LEDs are placed. From there we can learn how to write data to the 74HC595 shift registers and how to control the state of each individual LED inside the “bottle” (the blue LEDs).

Before we can start writing any code to control our LEDs, we first need to find out where exactly each LED is placed on the PCB. If you look at photo #2 you will see a silkscreen of the PCB board. The outside LEDs that make up the bottle shape are all green LEDs. We cannot control these individually, we can either turn them all on or all off. The same goes for the yellow LEDs that make up the lemon at the top of the bottle. Right now we are going to concentrate on the inside LEDs which are the blue LEDs that we can control individually. On the schematic all of the LEDs are labeled in a left to right, bottom to top manner.

Now, to know which LEDs to turn on we need to figure out which LED connects to which pin on which 74HC595. I have it set up so that if you count in a left to right, bottom to top manner, every 8 blue LEDs will make up one 74HC595 IC. The top 4 blue LEDs are connected to the 4th 74HC595 (IC4) and only use half of its outputs. Here are the LED connections to the 1st 74HC595 (IC1), as seen in photo #3.

QH -> LED7
QG -> LED8
QF -> LED9
QE -> LED12
QD -> LED13
QC -> LED14
QB -> LED17
QA -> LED18

The first 8 blue LEDs connect to IC1, the next 8 connect to IC2, the next 8 connect to IC3 and the next 4 connect to IC4. They all follow the same format as IC1**. Now I know what you’re thinking, “Why didn’t he wire QA to LED7 and QB to LED8 and QC to LED9…etc. instead so they all go in a straight through order?” Seems kinda backwards huh? Well the reason I chose to do it the way I did is because it made the PCB much easier to route. So I made it easier to route the hardware, but now it may make the software a little harder to write (its still quite easy).

**IC4 is actually connected up differently, I should have put the four LEDs on the upper 4 bits not the lower 4 bits. Not sure why I did that.How to Create a Beer Bottle LED VU Meter schematich

Step 9: Controlling The LEDs

Now that we understand how the LEDs are wired up, we can begin learning how to write data to each shift register so that we can control the LEDs. When we write data out of our PIC18F4550, it will first go into IC4. Then after IC4 fills up with 8 bits of data (1 byte), every bit shifted into IC4 after that will cause the MSb (Most Significant bit) of IC4 to be shifted into IC3 which will become the LSb (Least Significant bit) of IC3. So on so forth, all the way to IC1. I won’t go into great detail with this because there are already quite a few instructables here that deal with shift registers, so if you don’t fully understand the concept you can read up on them. I also posted a link to a good tutorial on 74HC595 shift registers at step #16.

Every LED is represented by 1 bit. In order to control each LED, we have to send 28 bits to the shift registers from the PIC18F4550. Seeing as we use the SPI protocol to transfer data to the shift registers, we actually end up sending 32 bits of data (4 bytes). This is because the SPI protocol only sends data 8 bits at a time with this particular microcontroller. Anyways, the extra 4 bits are not used and we will just ignore them (we’ll always leave them as 0). Once we shift the data into the 74HC595’s, we then “latch” them. Which means that whatever data we shifted into them, it will put that value (1 (high) or 0 (low)) onto its outputs. We’ll head into some examples now which may clear up some questions.

Example 1
Say we want to turn all of the blue LEDs ON. What would be the values for each byte of data we shift into each register? This is where some basic boolean logic will come into play. Seeing as these LEDs are active high (they turn on when we write a 1 to them) we have to write a 1 to turn them on or a 0 to turn them off. So if we want them all on, we would have to write this to the shift registers:

MSb         Lsb        Hex
IC1 – 1st Byte Sent -> 11111111          0xFF
IC2 – 2nd Byte Sent -> 11111111         0xFF
IC3 – 3rd Byte Sent -> 11111111          0xFF
IC4 – 4th Byte Sent -> 00001111          0x0F

So that one was pretty easy. We just made every bit that represents an LED equal to 1 (+5v). Then we’d latch the data in and it’d turn on all of the blue LEDs. Of course the 4 bits that are 0 are those ones that we are going to ignore and aren’t connected to any LEDs.

Example 2
Say we want to turn all of the blue LEDs OFF. This is another easy one, but what would we write to the shift registers?

MSb       Lsb            Hex
IC1 – 1st Byte Sent -> 00000000            0x00
IC2 – 2nd Byte Sent -> 00000000           0x00
IC3 – 3rd Byte Sent -> 00000000            0x00
IC4 – 4th Byte Sent -> 00000000            0x00

Now we just made every bit that represents an LED equal to 0 (0v). Then we’d latch the data in and it’d turn off all of the blue LEDs.

Example 3
What data would we send to turn on LED7, LED8, LED42, LED43, LED47 and LED52? All the other LEDs not mentioned should be turned off.

bit 7 —— bit 0
MSb          Lsb         Hex
IC1 – 1st Byte Sent -> 11000000           0xC0
IC2 – 2nd Byte Sent -> 00000000         0x00
IC3 – 3rd Byte Sent -> 00000110           0x06
IC4 – 4th Byte Sent -> 00001001           0x09

Once we latch it, it’ll turn on LED7 and LED8 which are bit 7 (QH) and bit 6 (QG) on IC1. Also bit 1 (QB) and bit 2 (QC) on IC3 will go high, turning on LED42 and LED 43. On IC4, bit 0 (QA) and bit 3 (QD) will go high, turning on LED47 and LED52.

Its really simple to turn on any of the inside LEDs. Just have a look at the schematic, figure out where the LEDs are that you want on and off, convert it into 4 bytes and your set. Next we’ll learn how to use functions that have been written for the PIC18F4550 to transmit the data to the shift registers.


For more detail: How to Create a Beer Bottle LED VU Meter

The post How to Create a Beer Bottle LED VU Meter appeared first on PIC Microcontroller.

Very Accurate LC Meter based on PIC16F628A

$
0
0

About Accurate LC Meter

This is one of the most accurate and simplest LC inductance / capacitance Meters that one can find, yet one that you can easily build yourself. This LC Meter allows to measure incredibly small inductances starting from 10nH to 1000nH, 1uH to 1000uH, 1mH to 100mH and capacitance from 0.1pF up to 900nF. LC Meter’s circuit uses an auto ranging system so that way you do not need to spend time selecting ranges manually. Another neat function is reset switch that will reset the initial inductance / capacitance, making sure that the final readings of the LC Meter are as accurate as possible.Very Accurate LC Meter based on PIC16F628A

Special Edition Accurate LC Meter Kit

Special Edition LC Meter Kit includes top notch high precision components that are only found in premium quality kits. It includes high quality double-sided printed circuit board (PCB) with red solder mask and pre-soldered tracks for easier soldering, LCD display with yellow-green LED backlight, programmed PIC16F628A microcontroller chip, high precision capacitors and inductor, 1% Metal Film resistors, Machined IC Sockets, gold plated header pins, LCD header connectors and all the other components that are needed to build a premium quality kit. Thanks to the use of LCD connectors LCD display can be detached from the main PCB board at any time even after the kit has been assembled. Special Edition Accurate LC Meter is designed for professionals that require unprecedented measurement accuracy and offers great value at low cost.

How does LC Meter Work?

To be able to determine the value of an unknown inductor / capacitor we can use the frequency formula given below.

Note that there are three variables that we can work with; f, L and C (f represents a frequency, L inductance and C capacitance). If we know the values of the two variables we may calculate the value of the third variable.

Lets say we want to determine the value of an unknown inductor with X inductance. We plug X inductance into the formula and we also use value of a known capacitor. Using this data we can calculate the frequency. Once we know the frequency we can use the power of the algebra and rewrite the above formula to solve for L (inductance). This time we will use the calculated frequency and a value of a known capacitor to calculate the inductance.

Isn’t this amazing? We just calculated the value of unknown inductor, and we may use the same technique to solve for the unknown capacitance and even frequency.

Applying the Theory to LC Meter’s Hardware

< width=”791″>

Now let’s use the above theory and apply it to electronics. The LC Meter uses a popular LM311 IC that that functions as a frequency generator and this is exactly what we need. If we want to calculate the value of an unknown inductor we use a known Ccal 1000pF capacitor and the value of an unknown inductor. LM311 will generate a frequency that we can measure with a frequency meter. Once we have this information we can use the frequency formula to calculate the inductance.

The same thing can be done for calculating the value of a unknown capacitor. This time we don’t know the value a capacitor so instead we use the value of a known inductor to calculate the frequency. Once we have that information we apply the formula to determine the capacitance.

All this sounds great, however if we want to determine the value of a lot of inductors / capacitors then this may become a very time consuming process. Sure, we can write a computer program to do all these calculations, but what if we don’t have an access to a computer or a frequency meter?

That’s were PIC16F628A microcontroller comes handy. PIC16F628A is like a small computer that can execute HEX programs that are written using an assembly language. PIC16F628A is a very flexible microcontroller because it has PINs which can be configured as inputs and outputs. Besides that, PIC16F628A IC requires very minimal number of external components like 4.000MHz crystal / resonator and a few resistors. Before PIC16F628A microcontroller can be used it has to be programmed with a HEX code which has to be sent from the computer. All Accurate LC Meter kits already come with microcontroller that is already programmed and ready to be used.

In the next step we use the frequency generated by LM311 IC and pass it on to PIC 16F628A’s PIN 17. We designate this PIN as an input, as well as all other PINs that are directly connected to switches. User can use these inputs to tell the microcontroller to execute specified set of instructions or perform calculations.

Once the microcontroller will calculate the unknown inductance or capacitance it will use PINs that are designated as outputs and pass the results onto the 16 character green backlighted LCD display.Very Accurate LC Meter based on PIC16F628A schematich

LC Meter’s Switches

< width=”9″ height=”82″>

< width=”791″>

Reset Switch – Resets capacitance / inductance readings
SW2 Switch – Capacitance / Inductance switch
Grounding PIC16F628A PIN12 displays the initial frequency of the LM311 oscillator which should be around 550KHz. This is usefull for testing LM311 oscillator.

For more detail: Very Accurate LC Meter based on PIC16F628A

Current Project / Post can also be found using:

  • lcd pic project

The post Very Accurate LC Meter based on PIC16F628A appeared first on PIC Microcontroller.

Trinket Powered Analog Meter Clock

$
0
0

Overview

Trinket lends itself very well to building clock projects, its small and easy to hide behind a larger display. And clocks don’t need a lot of logic, this example only has maybe 20 lines of code. Adding a digital display via I2C is possible using seven segment or character-based displays (with the library code posted for other projects).

This project interfaces Trinket to the the Adafruit DS1307 real-time clock (RTC) breakout board to form a clock. But in a twist, the display is done using two analog meters. One for hours, one for minutes.

The Trinket can output to a meter without digital to analog converters. Trinket has pulse width modulation (PWM) on three of its pins. The meter uses a moving coil inductance movement, acting to average the indication of current flowing through it. If you have narrow pulses, the average voltage it sees is lower, thus the current is lower for the fixed resistance attached to it. For wide pulses, the meter sees nearly the supply voltage and will stay around the full scale. This circuit varies the pulse width sent to the meters proportional to the hour of the day and the minutes after the hour.

For two meters, we will use two of the three PWM pins on Trinket (the third is also an I2C pin connected to the clock module).

There are several projects on the web using analog meters to tell time. The ease at which you can do this with Trinket allows you to build this type of clock quickly and compactly. You may focus on designing how to mount the meters in a creative way.

There are many ways to display the finished project. Rather than a cabinet or plexiglass display, I chose meters free-floating in a colorful box. I think it lends a modern look.

You can check Google Images for “Clock Analog Meter” for other mounting designs. Designing your own solution is the best part of such a project.
Trinket Powered Analog Meter Clock

Building the Circuit

Start by unpacking your Trinket. If you will use a breadboard or Perma-Proto board, you will want to solder on the header pins (provided). See Introducing Trinket on doing this and general information.

Unpack your DS1307 kit. This requires assembly also. Please follow the DS1307 Real Time Clock Breakout Board Kit tutorial on building your clock module.

Trinket can be powered from 3.7 to 16 volts via the BAT+ input and ground. This makes powering the clock very flexible. For this project, I chose the 5V Trinket as the DS1307 board has a 5 volt input which may be connected to the 5V output pin on Trinket. If you use another RTC module that works at 3.3 volts, the Trinket 3V may be used with appropriate changes to the meter calibration. I show powering via DC supply (wall wart). Battery use will vary depending on the batteries you choose. A 9 volt battery will not last very long and is not recommended.

For a 5 volt Trinket and 50 microamp meters, for full scale deflection we need a series resistor on each meter to keep the current less than or equal to the maximum current the meter can handle. Using Ohm’s law, R = V / I = 5 / .00005 = 100,000 ohms (100 K). You will need two of these resistors, preferably 5% or better tolerance. These are commonly available from electronics suppliers. If you want precision in calibrating the meter, you may want to substitute each resistor with a 100K potentiometer with a series resistor, perhaps 10 to 47 K. This allows for tuning the resistance. When I designed the project, the 100K resistors gave accurate enough time without needing potentiometers.

Do not directly connect the meter to a source of voltage as it will damage the meter. Use an appropriate series resistor in the circuit to limit the meter current.
Wiring is straightforward. All the pins are used except GPIO #3. I used this pin temporarily to connect to an FTDI Friend. On Trinket you can run a software serial library that transmits only. This was handy in debugging the circuit as it gives you console-like output using only one pin and ground.
The text will show the date and time along with two numbers which represent numbers from 0 to 255 for a pulse width corresponding to the time. Above, 255 shows this is noon, 13 minutes after the hour is 55/255 (not quite 1/4). If you are not getting this type of output on serial, check your connections and code.

Preparing to Code

 Using the Introducing Trinket tutorial, modify the Arduino IDE to work with Trinket by adding the hardware definition file, the avrdude.conf file, changing the ld.exe program from the 2008 dated version to the 2009 dated version, and install the driver for USBtinyISP appropriate to your operating system.
You must follow the instructions in the Introducing Trinket tutorial to set up your Arduino development environment properly, failure to do all the steps will not allow you to program a Trinket properly.

To prepare the Trinket for other programs, you will want to first load the Trinket Blink sketch into the Arduino software then load it onto the Trinket to verify everything works well. You must press the hardware reset button on the Trinket then quickly press upload in the Arduino software to upload a sketch. If you get an error, try the reset-upload process again. If you continually cannot load the blink sketch, check to make sure the Trinket is connected (without any wires connected to pins #3 and #4) and the Arduino IDE software has all the required changes.

Once the Blink sketch works, you should install the TinyRTClib and TinyWireM libraries. Installation of the libraries is as follows:

  1. Visit each of the code pages at Github.com: TinyRTClib and TinyWireM
  2. Select the “Download ZIP” button
  3. Uncompress each ZIP file after it’s finished downloading.
  4. The resulting folder should contain the code files and an “examples” sub-folder. Sometimes in Windows you’ll get an intermediate-level folder and need to move things around.
  5. Rename the TinyWireM library folder (containing the .cpp and .h files) to “TinyWireM”, and place it alongside your other Arduino libraries, typically in your (home folder)/Documents/Arduino/Libraries folder. Libraries should not be installed alongside the Arduino application itself.
  6. Do the same for the TinyRTClib library.
  7. Re-start the Arduino IDE if it’s currently running.

Here’s a tutorial that walks through the process of correctly installing Arduino libraries.

Now you are ready to copy the sketch on the next page for your clock.

Debugging Issues

For errors in the Arduino IDE software:

  • Ensure you have installed Trinket extensions, the USBtinyISP driver, and changed the ld.exe program as listed in the Introducing Trinket tutorial.
  • Ensure you have installed both the TinyWireM and TinyRTClib libraries..
  • Ensure you push the Trinket on board reset button before uploading your sketch, the red LED will blink when ready for upload, there is a 10 second window to do this.
  • If you place a large amount of code or other libraries in a sketch, it is very easy to exceed the available code space on the Trinket. If your program absolutely will not fit, consider switching to an Arduino Uno, Adafruit Boarduino, Pro Trinket, or Adafruit Flora with standard libraries.
  • If you get errors similar to the one below, you may have included decimal numbers and the floating point library was added by the Arduino IDE, exceeding the amount of program space available.

arduino-1.0.1/hardware/tools/avr/bin/../lib/gcc/avr/4.3.2/../../../../avr/lib/avr25/crttn85.o:(.init9+0x2):relocation truncated to fit: R_AVR_13_PCREL against symbol `exit’ defined in .fini9 section in /arduino-1.0.1/hardware/tools/avr/bin/../lib/gcc/avr/4.3.2/avr25\libgcc.a(_exit.o)

The code on the next page still leaves a good deal of space for additional functionality, especially once the serial code is no longer needed. If you declare large arrays, define large text strings, add decimal/floating point numbers, or other libraries, the space may fill up or overflow.

Code

 You will want to run the sketch twice, once to set the clock, another to have it operate. The code in setup() checking for rtc.isrunning() should be uncommented. This will set the clock to the time your code is compiled. You can then recomment out that code as the DS1307 will keep the time.

If you plan to have the code function differently than the sample or have problems you want to debug, having a serial monitor will help. I have tried the SendOnlySoftwareSerial library available in this arduino.cc post with good results. It adds about 1300 bytes of overhead so you will want to comment out the serial code in your sketch when you do not need it.

The post Trinket Powered Analog Meter Clock appeared first on PIC Microcontroller.

Viewing all 90 articles
Browse latest View live


<script src="https://jsc.adskeeper.com/r/s/rssing.com.1596347.js" async> </script>